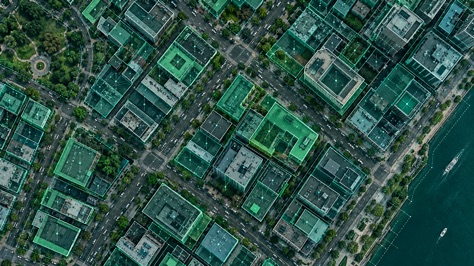
A building can be easy to see in an aerial image and still be difficult to turn into a useful map object. The gap between those two tasks—recognizing a roof and producing a clean, reliable polygon—is where much of the real work in building vectorization begins.
The November 2026 issue of the ISPRS Journal of Photogrammetry and Remote Sensing highlights that gap through Pixels, Points and Polygons, a dataset and benchmark for multimodal building vectorization. The authors combine high-resolution aerial imagery, aerial LiDAR point clouds, and vectorized building outlines rather than treating RGB imagery as the only useful input.
The result is not a claim that every building-mapping problem now has one best solution. It is a more useful lesson: input modality, geographic diversity, and polygon quality all affect whether model output can survive the transition from a computer-vision demonstration to a working GIS layer.
Building Segmentation and Building Vectorization Are Not the Same Task
Semantic segmentation asks which pixels belong to buildings. That is a valuable first step, but a pixel mask is not automatically a usable building footprint. A GIS polygon also has to represent boundaries, corners, holes, adjacency, and separate structures in a way that downstream software can process.
A mask can look convincing on screen while producing awkward geometry after polygonization. Roof edges may become jagged. A long straight wall may contain many redundant vertices. Neighboring buildings may merge. Courtyards may disappear, and a regular rectangular structure may become an irregular outline.
Practical distinction: segmentation identifies building-like pixels; vectorization must convert evidence into discrete geometries whose boundaries and structure remain useful in GIS.
What the P³ Dataset Adds
The P³ dataset was designed around three aligned components: aerial RGB imagery, aerial LiDAR point clouds, and vector building outlines. According to the authors, it contains more than 10 billion LiDAR points, RGB imagery with a 25-centimeter ground sampling distance, and data collected across three continents. The project also publishes code and pretrained weights for building-polygon prediction.
That combination matters because each input describes the built environment differently.
- Aerial imagery records color, texture, shadows, and visible roof patterns. It is intuitive to inspect, but trees, shadows, perspective effects, and similar-looking surfaces can obscure boundaries.
- LiDAR point clouds record three-dimensional structure. Height discontinuities can help distinguish a roof from surrounding ground or vegetation, although point density, acquisition conditions, and preprocessing still shape what the model receives.
- Vector annotations define the target as polygons rather than only pixel labels. This makes geometry itself part of the learning and evaluation problem.
The benchmark reports that LiDAR is a valuable source for building-outline prediction and that fusing LiDAR with imagery can improve prediction accuracy and geometric quality within the evaluated settings. It also finds that current methods still have limitations in efficiency, regularity, or both.
Why Geographic and Acquisition Diversity Matter
Building appearance changes across regions. Roof materials, density, architectural style, vegetation, terrain, and acquisition geometry can all shift the visual patterns a model encounters. A model that performs well on one city may have learned cues that do not transfer cleanly to another.
Multimodal data can provide complementary evidence, but evaluation still needs to expose regional and sensor variation. When a project moves to a new operating area, the question becomes: “How does this model behave on our imagery, building stock, and output requirements?”
Polygon Quality Needs Its Own Evaluation
Pixel overlap metrics are useful, but they do not fully describe whether a footprint is practical. Two outputs can have similar overlap with a reference mask while differing substantially in boundary smoothness, corner placement, vertex count, or structural regularity.
The P³ work includes evaluation of geometric quality, including symmetry and regularity. That choice reflects a practitioner concern: clean geometry is not merely cosmetic. It affects editing effort, spatial measurements, topology checks, and how confidently a layer can be reused.
A production-oriented evaluation should therefore consider several questions together:
- Are buildings detected or missed at an acceptable rate for the intended task?
- Are nearby structures separated correctly?
- Do boundaries align with the source evidence?
- Are polygons simple and regular enough for downstream GIS operations?
- How much human correction is required before delivery?
What the Benchmark Does—and Does Not—Establish
The study provides evidence for the value of multimodal building-vectorization research under its datasets, models, and evaluation protocol. It does not establish that LiDAR is required for every project, that a fused model will always outperform an imagery-only model, or that published weights will transfer unchanged to any city.
The important decision is not “Which modality is universally best?” It is “Which evidence is available, aligned, licensed, current, and fit for this mapping objective?”
A Practical Route from Benchmark to Workflow
Teams evaluating building extraction can borrow the paper’s framing without copying its experimental setup.
- Define the deliverable. Decide whether the output is a screening mask, editable roof outlines, or database-ready polygons.
- Audit the inputs. Record imagery resolution, season, viewing geometry, coordinate system, LiDAR density, alignment, and acquisition dates.
- Test by geography. Hold out areas that differ meaningfully from training data, rather than relying only on random tiles from the same source.
- Evaluate geometry. Inspect boundaries, corners, building separation, holes, redundant vertices, and topology alongside detection metrics.
- Measure review effort. Track the types and frequency of corrections required before the layer is usable.
ESA’s building-footprint capability overview makes a similar operational point: AI-derived outlines can support planning, risk, and disaster applications, but accuracy depends on imagery and training data, and manual correction may still be necessary.
Frequently Asked Questions
Test Building Detection on Your Imagery
Start with your own aerial or satellite image and review how an imagery-based building layer fits your GIS workflow.
Try WetuneAI for Free →Sources and Further Reading
- Pixels, points and polygons: A dataset and benchmark for multimodal building vectorization, ISPRS Journal of Photogrammetry and Remote Sensing, November 2026.
- The P³ Dataset: Pixels, Points and Polygons for Multimodal Building Vectorization, ISPRS Annals, July 2026.
- PixelsPointsPolygons repository, dataset access, code, and pretrained-model links.
- Building Footprints, ESA Global Development Assistance Knowledge Hub.