In the aftermath of a major disaster, the first 72 hours decide who gets rescued, who gets aid, and how fast a community rebuilds. Yet for decades, one of the most critical inputs into that response — knowing which buildings are damaged, how badly, and where — has been produced the slow way: teams on the ground, walking block by block, tallying damage by hand.
2026 is the year that changed. When earthquakes struck Venezuela, when back-to-back storms cut off forty Alaskan villages, and when the strongest hurricane in Jamaica's history made landfall, the response had a new tool in the arsenal: AI that reads drone and satellite imagery, detects every building, and flags damage in hours instead of weeks.
The First 72 Hours Decide Everything
The first three days after a disaster are the golden window for rescue. Roads are blocked, communications are down, and every decision — where to send search teams, where to open shelters, where to prioritize aid — depends on knowing the state of the built environment. But traditional damage assessment can't keep up. Ground teams are slow, physically dangerous, and can only cover a fraction of the affected area. Helicopter surveys are expensive and grounded by weather.
The result is a brutal mismatch: decisions that need to happen in hours are being informed by assessments that take weeks. That mismatch is exactly what AI building damage assessment is designed to close.
How AI Building Damage Assessment Works
The pipeline is conceptually simple but technically demanding. It fuses computer vision, change detection, and damage classification into a single automated flow:
- Capture. Drones and satellites collect high-resolution imagery of the affected area in the hours after a disaster.
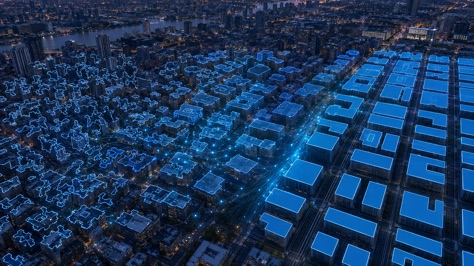
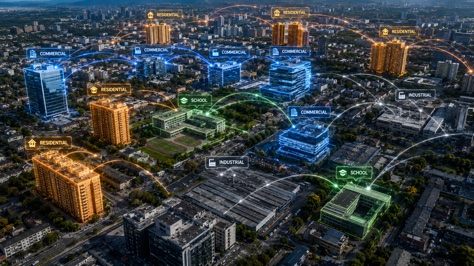
- Detect. AI building detection models find and delineate every structure in the imagery, producing georeferenced footprints.
- Compare. Post-disaster detections are compared against a pre-disaster baseline to identify which buildings are new, gone, or changed.
- Classify. A damage model grades each building — none, minor, major, destroyed — typically against a recognized scale like EMS-98.
- Deliver. Results are output as polygons with damage attributes, ready for a GIS, a response dashboard, or an insurance workflow.
Every one of those steps used to require human experts. Today, most of it runs automatically — which is the entire point.
From Weeks to Hours: The Numbers
The single most important shift is temporal. Here's what a full regional damage assessment looks like under three different approaches:
That last bar is the story of 2026. When assessment drops from weeks to hours, it stops being a report that documents the disaster and becomes an input that shapes the response in real time.
Three Things That Changed in 2026
1. Pre-disaster baselines now exist. Datasets like Google Open Buildings have mapped billions of structures globally. When disaster strikes, responders no longer start from zero — there is already a "before" picture to compare against, and change detection works far better with a clean baseline.
2. Drones went mainstream in emergency response. From Japan's expanding drone-based disaster programs to the volunteer drone non-profits that covered Jamaica's record hurricane, the hardware is now cheap, portable, and widely deployed. What was missing was software that turns drone footage into structured damage data — and that gap is closing fast.
3. Damage-classification models matured. Models trained on post-earthquake, post-hurricane, and post-wildfire imagery can now grade building damage with accuracy approaching ground-truth surveys, at a fraction of the time and cost. The hard part is no longer "can AI see the damage" — it's delivering the result in a form a response team can act on.
What This Means for Insurance and Recovery
For insurers, AI damage assessment transforms claims. Instead of dispatching an adjuster to every structure, carriers triage claims from imagery — routing field adjusters only to the complex cases and settling clear-cut ones remotely. The result is faster payouts, lower loss-adjustment costs, and a faster return to normal for policyholders.
For governments and aid agencies, the same data powers relief allocation and reconstruction planning: knowing exactly which buildings are destroyed, which are repairable, and how the damage is distributed across a region. When you can see the damage as a map instead of a spreadsheet, resources stop being spent on guesswork.
Frequently Asked Questions
Building Detection That Holds Up Under Pressure
From drone or aerial imagery, WetuneAI extracts georeferenced building footprints with the speed and precision that disaster response — and every geospatial workflow — demands.
Try WetuneAI for Free →